

If you're still reporting on "course completion rates" or "quiz scores," you’re playing a losing game. To turn into an enablement superstar, you need a dashboard for tracking the right sales enablement KPIs - the ones that prove your work results in revenue, not just "learning activity."
Only 43.8% of enablement pros are aligned with senior leadership on the metrics they should be measured on. And 61.2% say measuring enablement impact is their biggest challenge.
In this guide, we’re going to fix this gap. We’ll move past the vanity metrics and build a shrewd, data-backed system that finally proves your worth.
So what should you actually measure?
By the end of this guide, you’ll have:
A framework (lead vs lag + performance/proficiency/productivity)
A core 12 set of sales training KPIs with formulas (and what to do when they move)
A CRM guide for data source
What are sales training metrics?
Sales training metrics are measurements. They tell you what happened (attendance, completion, roleplay scores, call behaviors, time-to-first-deal, etc.).
Sales enablement KPIs are the few metrics you choose because they’re tied to business outcomes (win rate, sales cycle length, quota attainment, revenue per rep). In other words:
Metrics = what you can measure
KPIs = what you should bet your reputation on
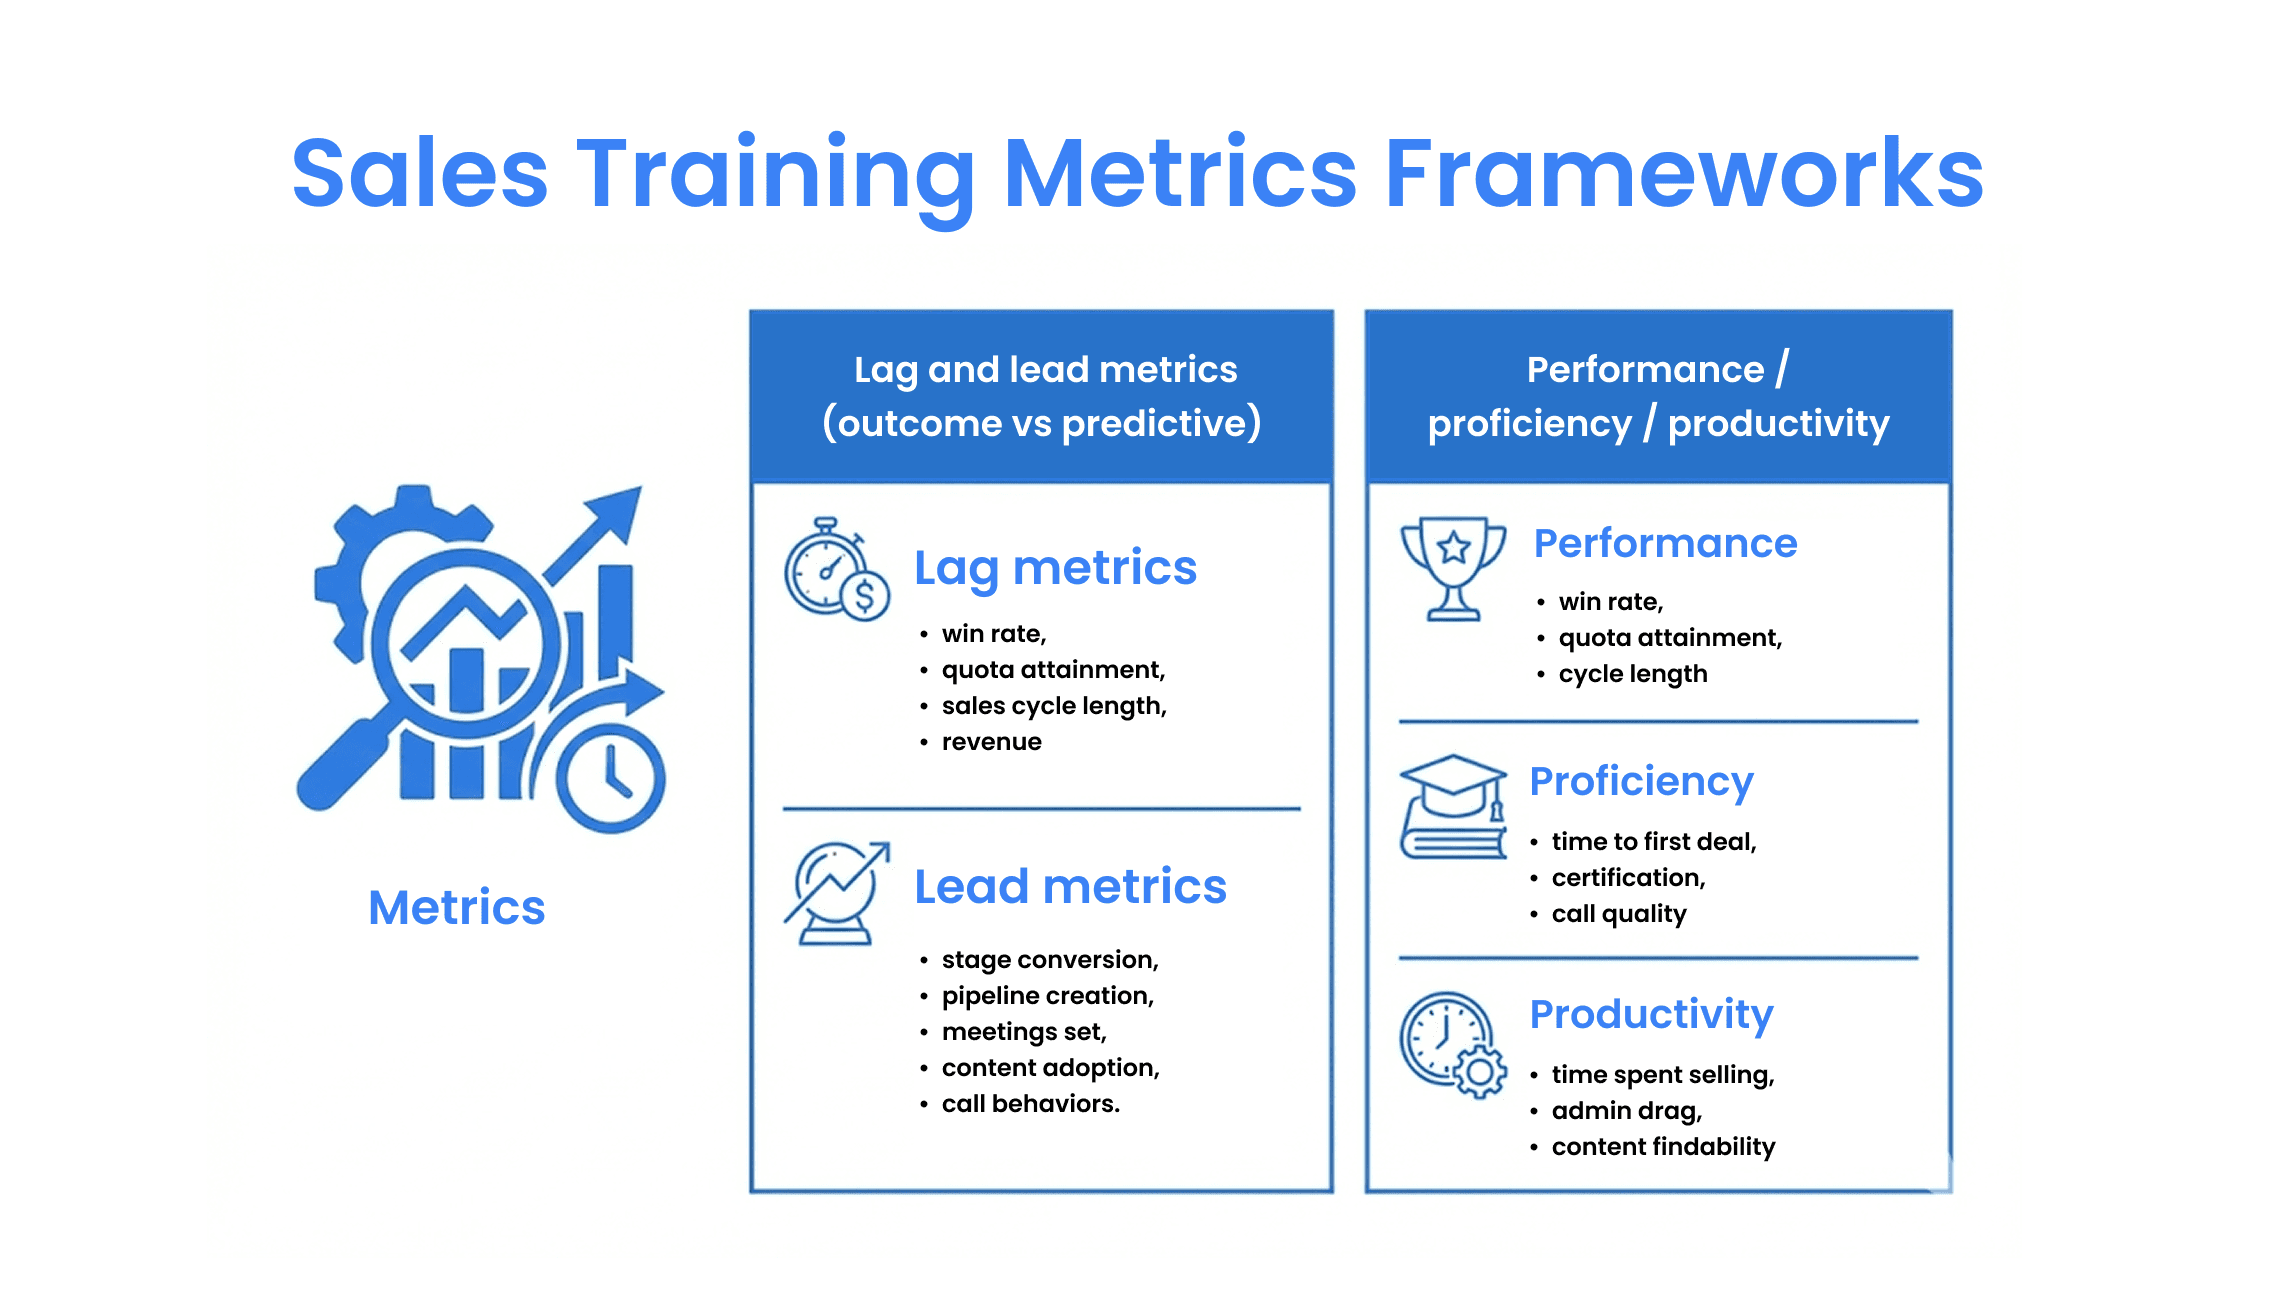
Sales Training Metrics Frameworks
The cleanest way to stop metric chaos is to run a two-layer filter:
1) Lead vs lag metrics (predictive vs outcome)
Lag metrics tell you if you won (results): win rate, quota attainment, sales cycle length, revenue.
Lead metrics tell you if you’re about to win (predictors): stage conversion, pipeline creation, meetings set, content adoption, call behaviors.
2) Performance / proficiency / productivity
Use this to ensure your training is building skill and changing behavior (not just “completed modules”).
Performance: outcomes that leadership cares about (win rate, quota attainment, cycle length)
Proficiency: skill development + ramp indicators (time to first deal, certification, call quality)
Productivity: efficiency + capacity (time spent selling, admin drag, content findability)
The Core 12 Sales Training Metrics to Track (and What They Tell You)
Below is a practical set of sales enablement metrics that covers ROI, ramp, and in-field execution—without drowning in 62 KPIs nobody uses.
Rule: If a metric doesn’t drive a decision, it’s not a KPI. It’s trivia.
Core 12 table (metrics, formulas, sources, decisions)
Metric | Formula | Lead/Lag | Where the data lives | Decision |
Win rate | Won deals ÷ total opportunities | Lag | CRM | Fix late-stage enablement gaps (objections, competitive, negotiation) |
Quota attainment rate | Reps ≥ quota ÷ total reps | Lag | CRM | Target coaching + role-based training paths |
Sales cycle length | Total days to close ÷ # closed-won | Lag | CRM | Identify friction stages; build stage-specific enablement |
Average deal size (ACV) | Total ACV ÷ # closed-won | Lag | CRM | Upgrade discovery + value messaging + negotiation training |
Stage conversion rate | Stage-to-stage conversions ÷ stage entries | Lead | CRM | Diagnose which stage needs practice |
Pipeline created per rep | $ pipeline created ÷ # reps | Lead | CRM | Improve prospecting messaging, discovery qualification |
Time to first deal | Date of first closed-won − hire date | Lead→Lag bridge | CRM + HRIS | Tighten onboarding; “quick win” enablement |
Time to productivity (ramp time) | Date rep hits defined target − hire date | Lag | CRM + HRIS | Prove onboarding ROI; refine ramp playbook |
Call quality / call score trend | Avg score post-training − pre-training | Lead | Conversation intelligence (CI) | See if training changes behavior in the field |
Coaching coverage | # coached reps ÷ total reps (per month) | Lead | CI + coaching logs | Ensure coaching isn’t random; scale best practices |
Content adoption rate | Sellers who used asset in deals ÷ total sellers | Lead | Enablement platform + CRM | Prune/boost assets; fix relevance and findability |
Content influence on outcomes | Win rate w/ asset − win rate w/o asset | Lead→Lag bridge | CRM + enablement platform | Stop “content for content’s sake”; invest in what moves revenue |
Sales Training Dashboard (Weekly vs Monthly)
Dashboard table (what to show weekly vs monthly)
Cadence | What to track | Why it matters | Who owns it |
Weekly | Stage conversion, pipeline created, meetings set, call score trends, coaching coverage | Catch problems early (lead indicators move before revenue does) | Enablement + RevOps + managers |
Monthly | Win rate, sales cycle length, quota attainment, time to first deal, content adoption | Connect training to outcomes; adjust programs | RevOps + sales leadership |
Quarterly | Time to productivity (ramp), ROI story (cohort lift), retention/expansion metrics (if CS) | Executive narrative + budget justification |
Common Mistakes That Make Training Metrics Useless (And Fixes)
Mistake 1: Tracking too many metrics
Fix: Use the Core 12 and stop collecting trivia.
Mistake 2: Vanity metrics (views, attendance) treated as impact
Fix: Track content adoption rate formula metrics tied to deals, plus influence on win rate.
Mistake 3: Static training that doesn’t adapt to real gaps
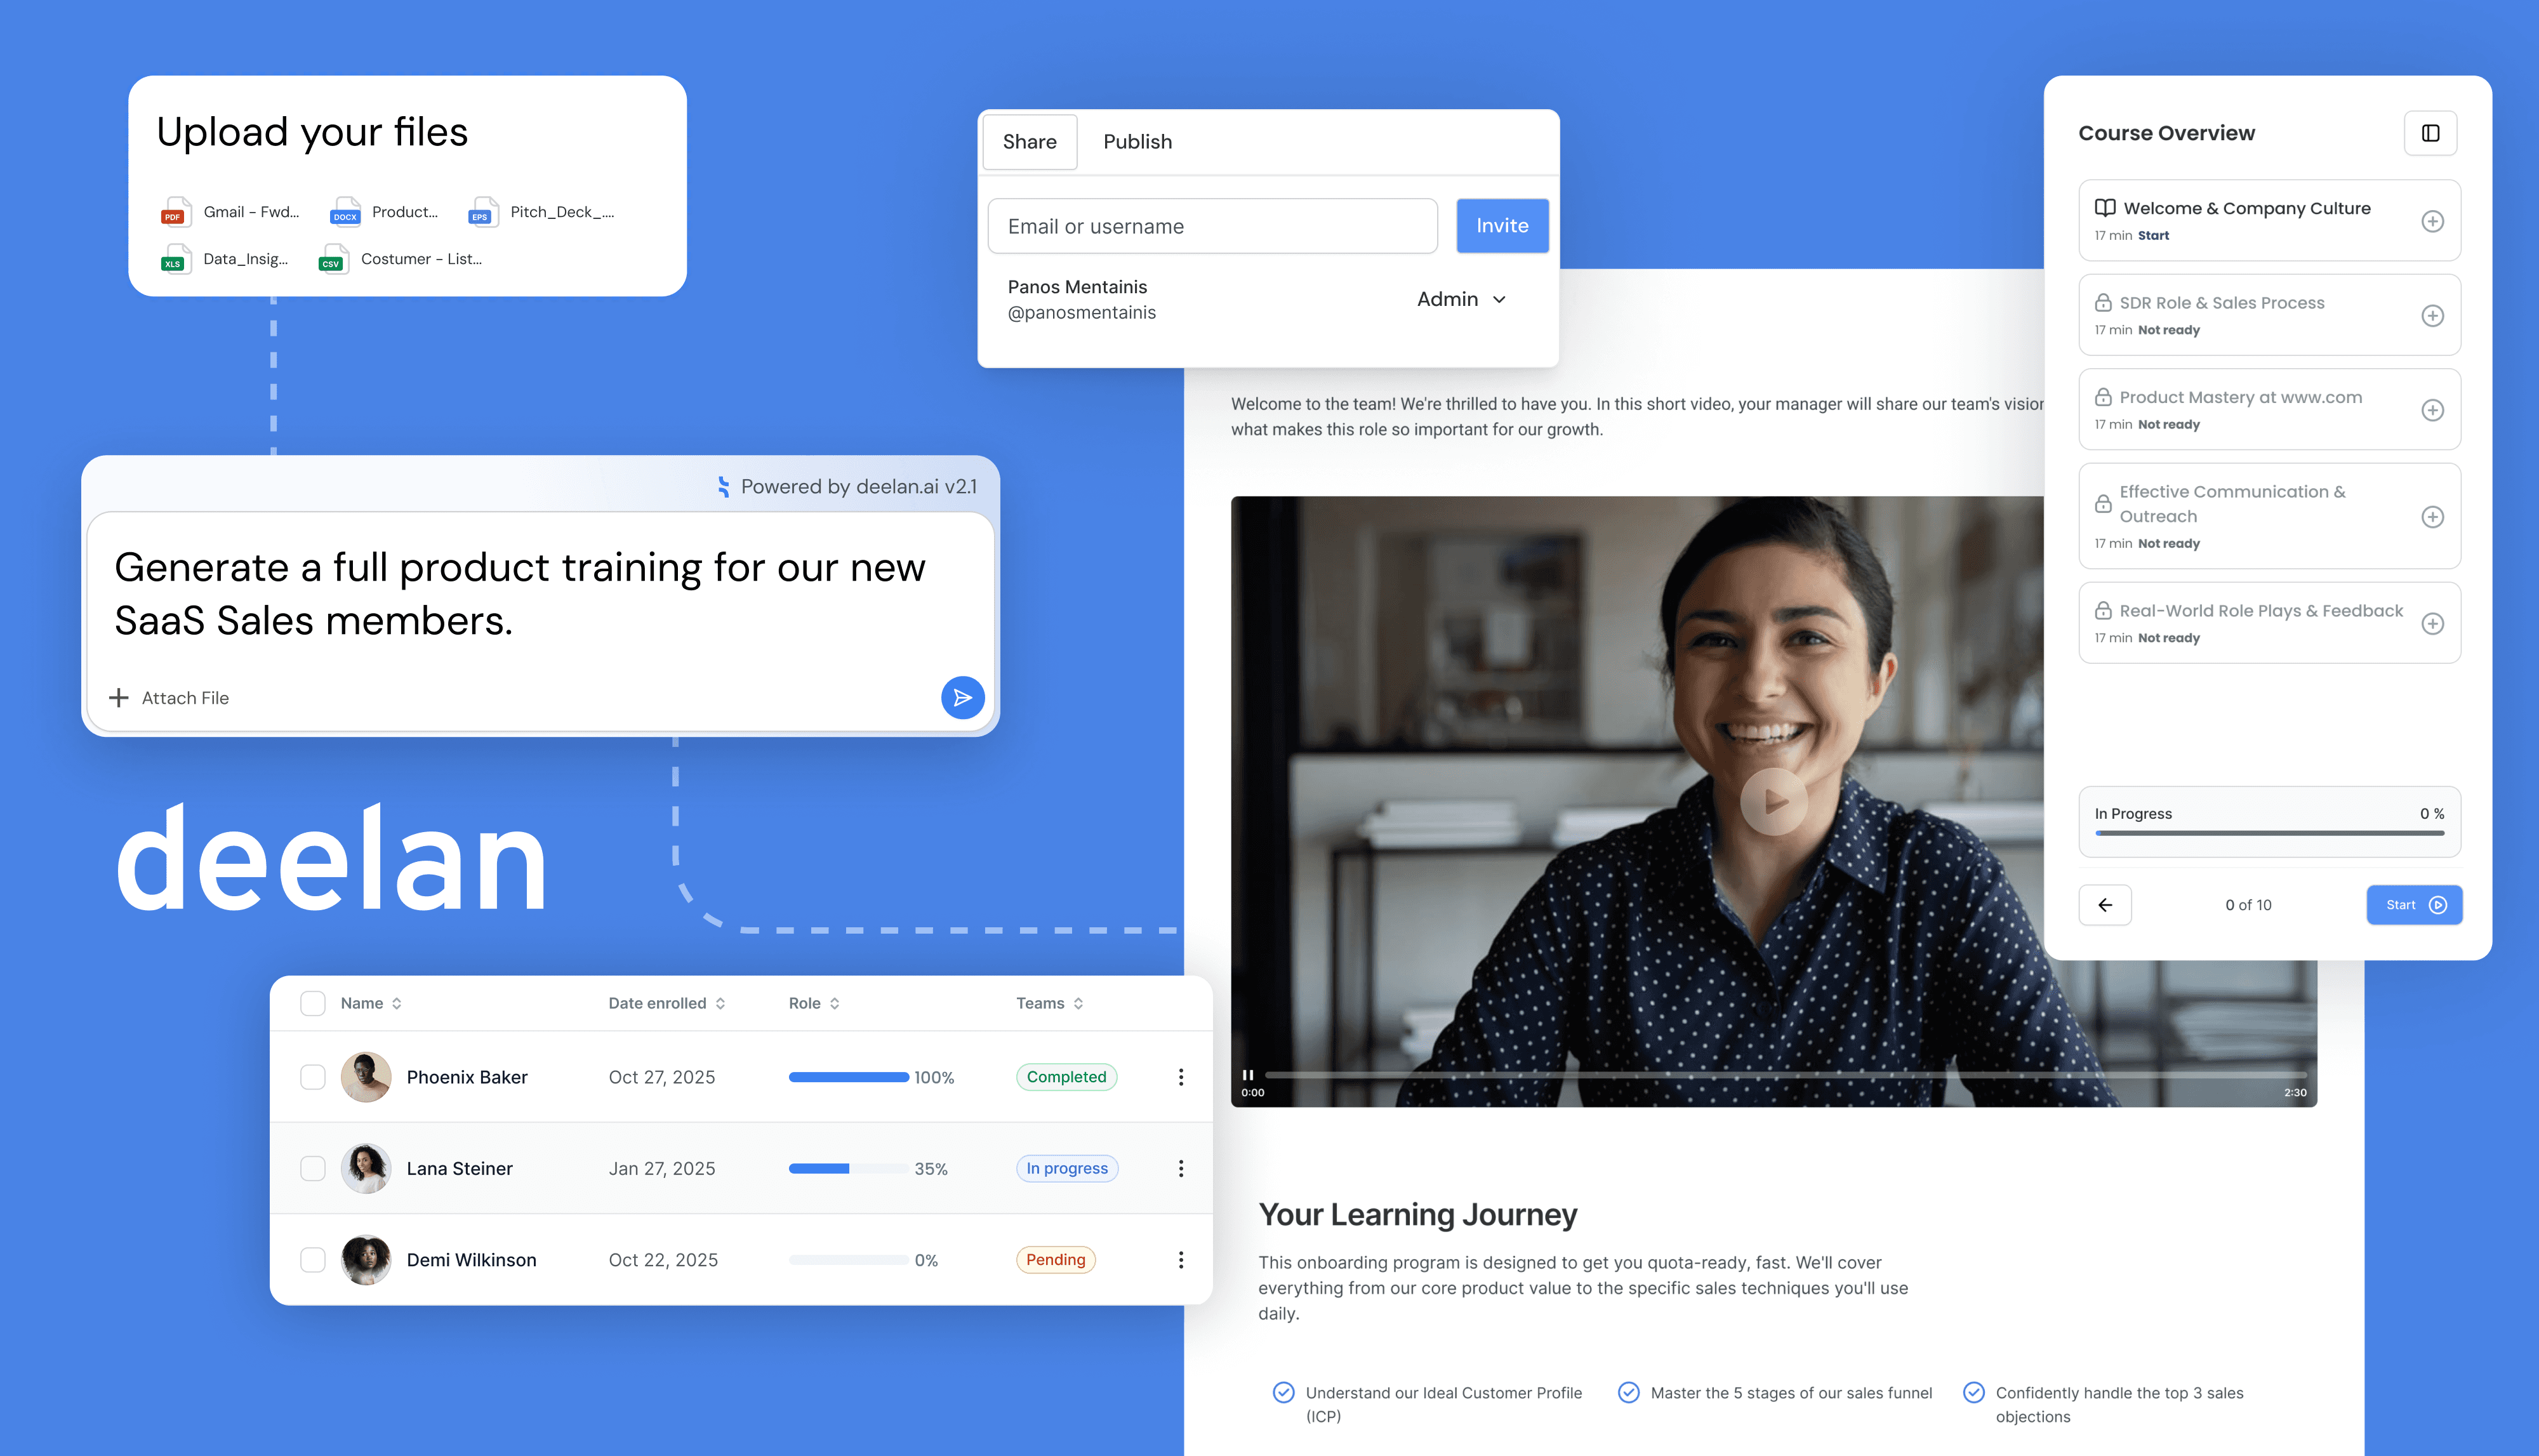
Fix: Move from one-size-fits-all to role-based, performance-aware enablement. That’s the core promise of adaptive training - turn knowledge into paths reps actually need, reinforce it continuously, and measure behavior change before revenue changes. Deelan’s reported impact - 80% faster training creation and 55% faster ramp - exists because it’s built around that loop.
Get Free demo of Deelan platform.
FAQ: Sales Training Metrics & Enablement KPIs
What are the best sales training metrics?
The best metrics connect training to outcomes: win rate, quota attainment, sales cycle length, ramp time, time to first deal, stage conversion, call score trends, and content adoption.
How do you measure sales training ROI?
Use cohort comparisons (trained vs untrained), pre/post with controls, or phased rollouts. Validate behavior change first (call scores, stage conversion), then confirm lag outcomes (win rate, cycle length).
What’s the difference between metrics and KPIs in enablement?
Metrics are measurements; KPIs are the few metrics tied directly to business goals and used to make decisions.
What is a good ramp time?
It depends on segment, cycle length, and role. Treat benchmarks as directional, and always segment by tenure, region, and market motion. (Your own baseline is the most credible starting point.)
What is content adoption rate?
A practical definition: the percentage of sellers who actually use an asset in active deals (not just view it). This is why logging content-to-opportunity matters.


