
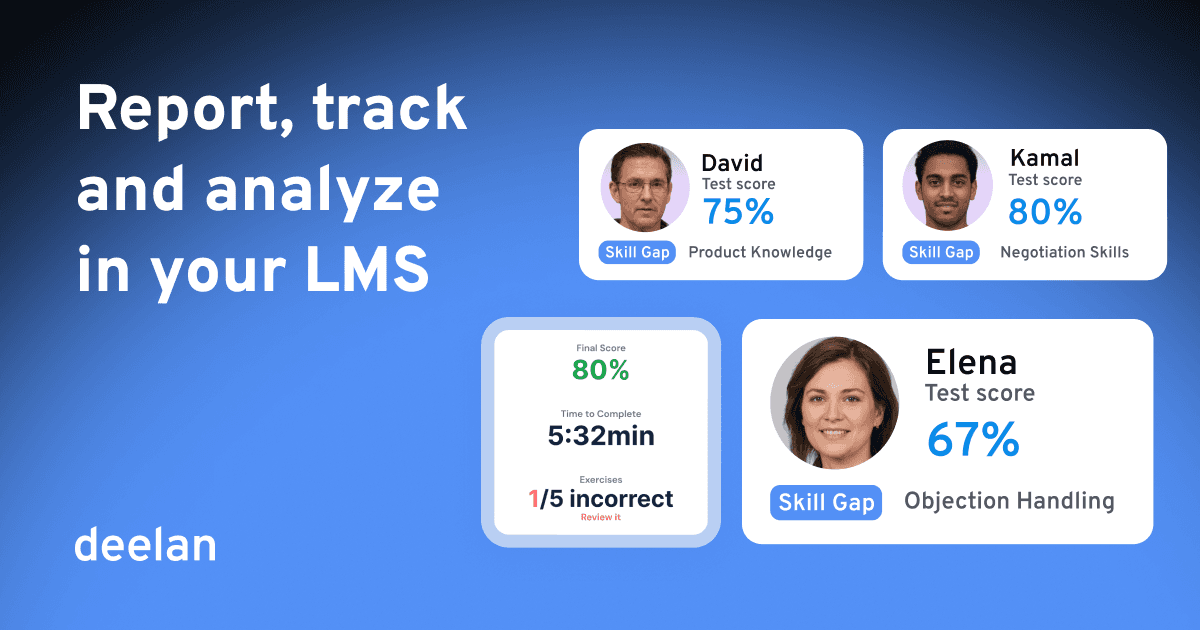
Completion rate is a vanity metric. A rep can click through every slide in your onboarding and still fumble a discovery call on day 30. If your training analytics stop at "100% completed," you're measuring the wrong thing.
This guide covers what LMS analytics should actually show for revenue teams, including the newer layer most platforms ignore: roleplay and conversation analytics.
Key Takeaways
What matters | Why |
|---|---|
Track progress and performance, not just completion | Completion doesn't predict quota attainment |
A rep might know the answer but can't say it under pressure | |
Cohort-level gap analysis beats individual reports | You need to know what to fix across the team, not just per person |
At-risk detection before outcomes slip | Catching someone falling behind in week 2 is easier than fixing it in week 6 |
Analytics should connect to coaching actions | A dashboard nobody acts on is just noise |
The old way problem: training that measures completion
Traditional training slows teams down because it’s built around content delivery, not performance outcomes:
One-size-fits-all generic content
Slow onboarding & ramp time
No adaptation to role or skill gaps
Managers repeating the same coaching
Measures completion, not quota attainment
Knowledge stuck in top performers’ heads
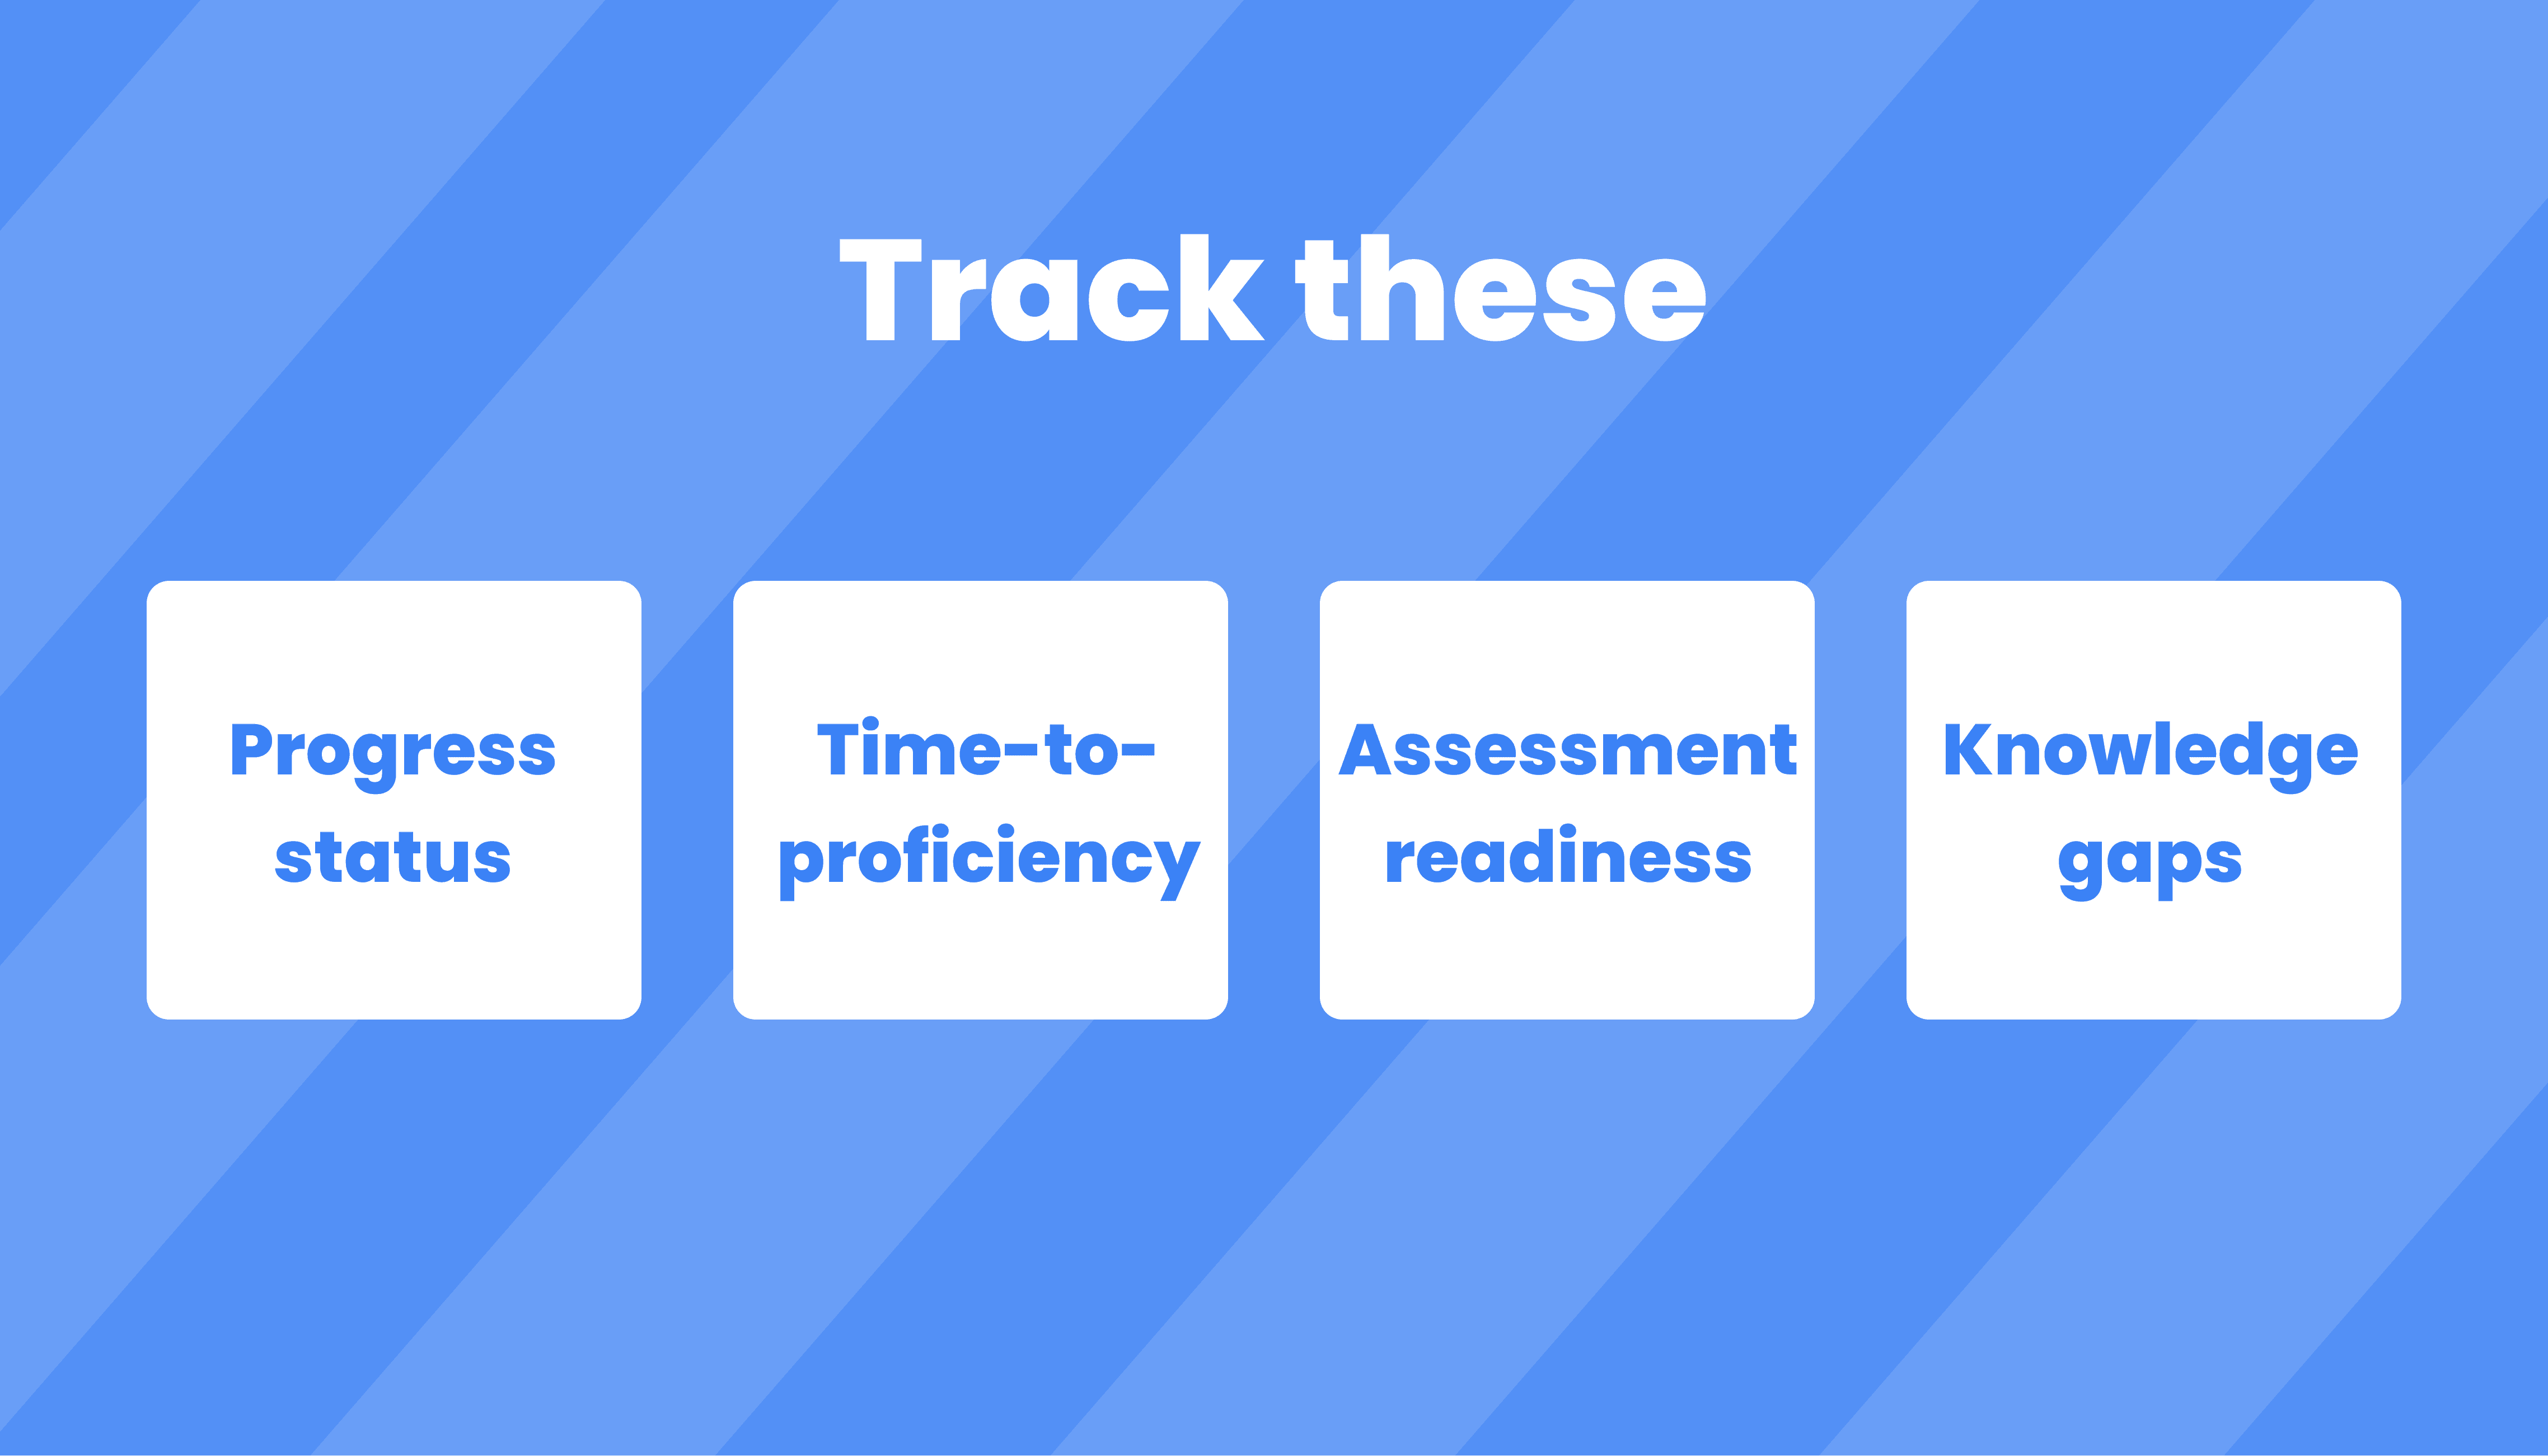
What actually to track in your LMS tracking and reporting?
Track these, and you can actually act:
Progress status (not started / in progress / completed)
Decision: Who needs manager follow-up vs self-serve?Time-to-proficiency (ramp time proxy)
Decision: Which onboarding path is working—and which isn’t?Assessment readiness + attempts
Decision: Who is ready for certification vs at-risk?Knowledge gaps by cohort (team, region, department)
Decision: What to retrain across the org vs targeted coaching?Program adherence (who’s falling behind in a program)
Decision: Where to intervene before outcomes slip.
LMS reporting tools: the must-have capabilities
When buyers compare LMS reporting tools, most lists focus on exports and filters. That’s baseline. What matters is whether reporting is usable in real operations.
Use this checklist:
Role-based visibility (exec summary vs trainer drill-down vs learner view)
Actionable dashboards (not data dumps)
At-risk detection (early warning signals)
Learner-level profiles (progress + achievements + performance context)
Automation (notifications, nudges, scheduled flows)
Gap analysis + recommendations (what to do next)
Proof-ready outputs (certificates, completion evidence, readiness signals)
Deelan reporting & analytics features
1) Track your team progress (simple, actionable analytics)
Deelan helps you track learner progress without drowning in charts.
You see:
who is progressing,
who is stuck,
who is ready,
who needs support.
And you can act immediately: assign remediation, nudge managers, adjust the program.
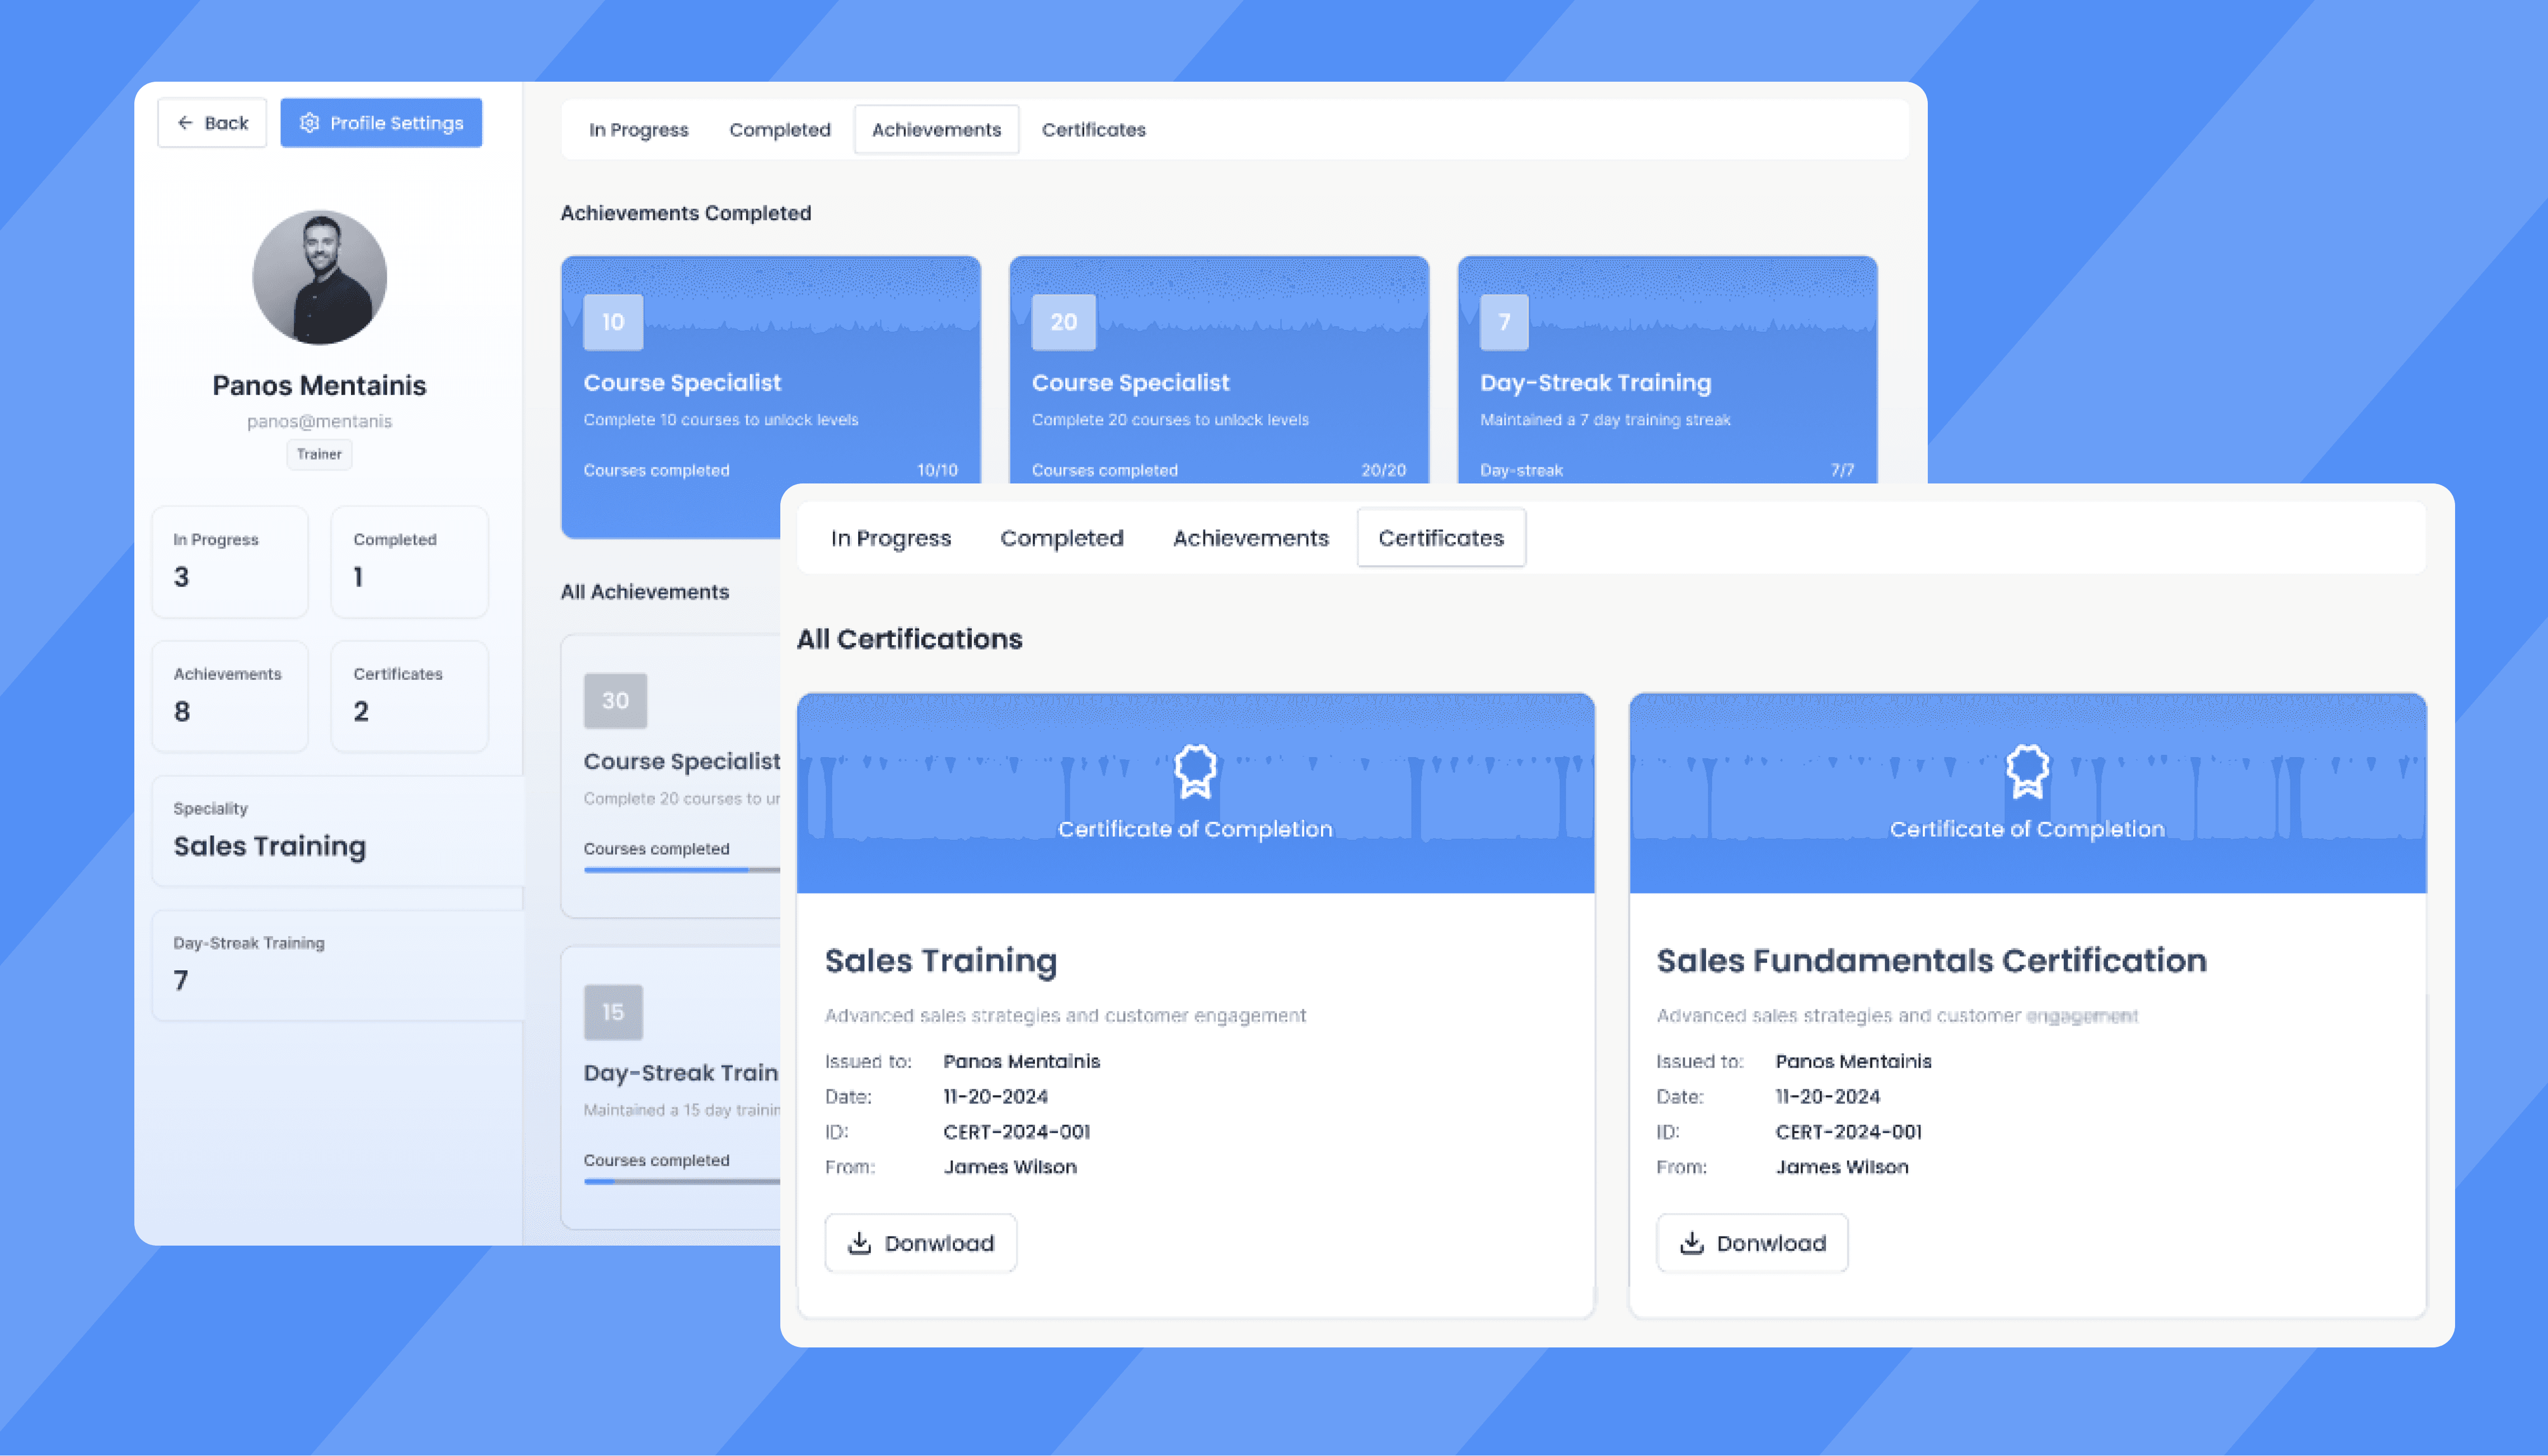
2) My Training Dashboard
This is what learners actually use.
It tracks:
in-progress programs
completed content
achievements
certificates
3) Smart Knowledge Recommendations (AI-powered gap analysis)
This is where Deelan becomes performance-driven.
It detects:
knowledge weaknesses across departments or cohorts,
recurring gaps that correlate with poor execution,
what content should be assigned next.
4) Trainer Program Management (monitor + intervene)
Trainers and enablement leaders need a program view, not a spreadsheet.
Deelan lets you:
monitor learner progress by program
identify at-risk participants early
manage enrollments per program
This enables a clean operating cadence: weekly check, quick interventions, consistent outcomes.
5) Member & Learner Progress Profiles (the single source of truth)
Each learner has a detailed profile that includes:
training progress
achievements
certificates
streaks
performance stats
This is the difference between “they completed it” and “they’re improving.”
6) Notification System (real-time signals)
Deelan supports real-time notifications for:
shares and mentions
achievements
assignments
content updates
Low cost LMS subscription that has solid analytics: how to evaluate value
“Cheap” becomes expensive when analytics are weak. If you can’t see who’s at risk, what to fix, and which program works, you pay in:
longer ramp time
more manager coaching hours
inconsistent execution
missed targets you can’t explain
A cost-effective LMS isn’t the one with the lowest price. It’s the one that reduces:
coaching load (fewer repeated explanations),
ramp time (faster readiness),
and rework (targeted remediation vs blanket training).
Deelan is cost-effective because it reduces coaching load + ramp time—by using actionable reporting and AI-backed gap recommendations instead of “completion-only” dashboards.
For broader budget comparisons, see: Low-budget LMS comparison, and Guide: how to choose the best LMS.
FAQ
What's the difference between LMS reporting and LMS analytics?
Reporting shows what happened: completions, enrollments, scores. Analytics interprets that data to suggest what to do next, flagging at-risk learners, surfacing skill gaps, recommending content. Both are necessary, but most platforms are heavier on reporting than analytics.
Can LMS analytics prove training ROI?
Direct attribution is hard. What you can measure are strong proxies: reduced ramp time, improved certification rates, higher roleplay scores correlating with win rate improvements, fewer repeated coaching conversations on the same topics. Over time, those proxies build a case.
How often should sales leaders review training data?
Weekly for operational signals (who's behind, what gaps are emerging, who needs intervention). Monthly for program-level decisions (what's working, what to rebuild, where to reallocate content investment).
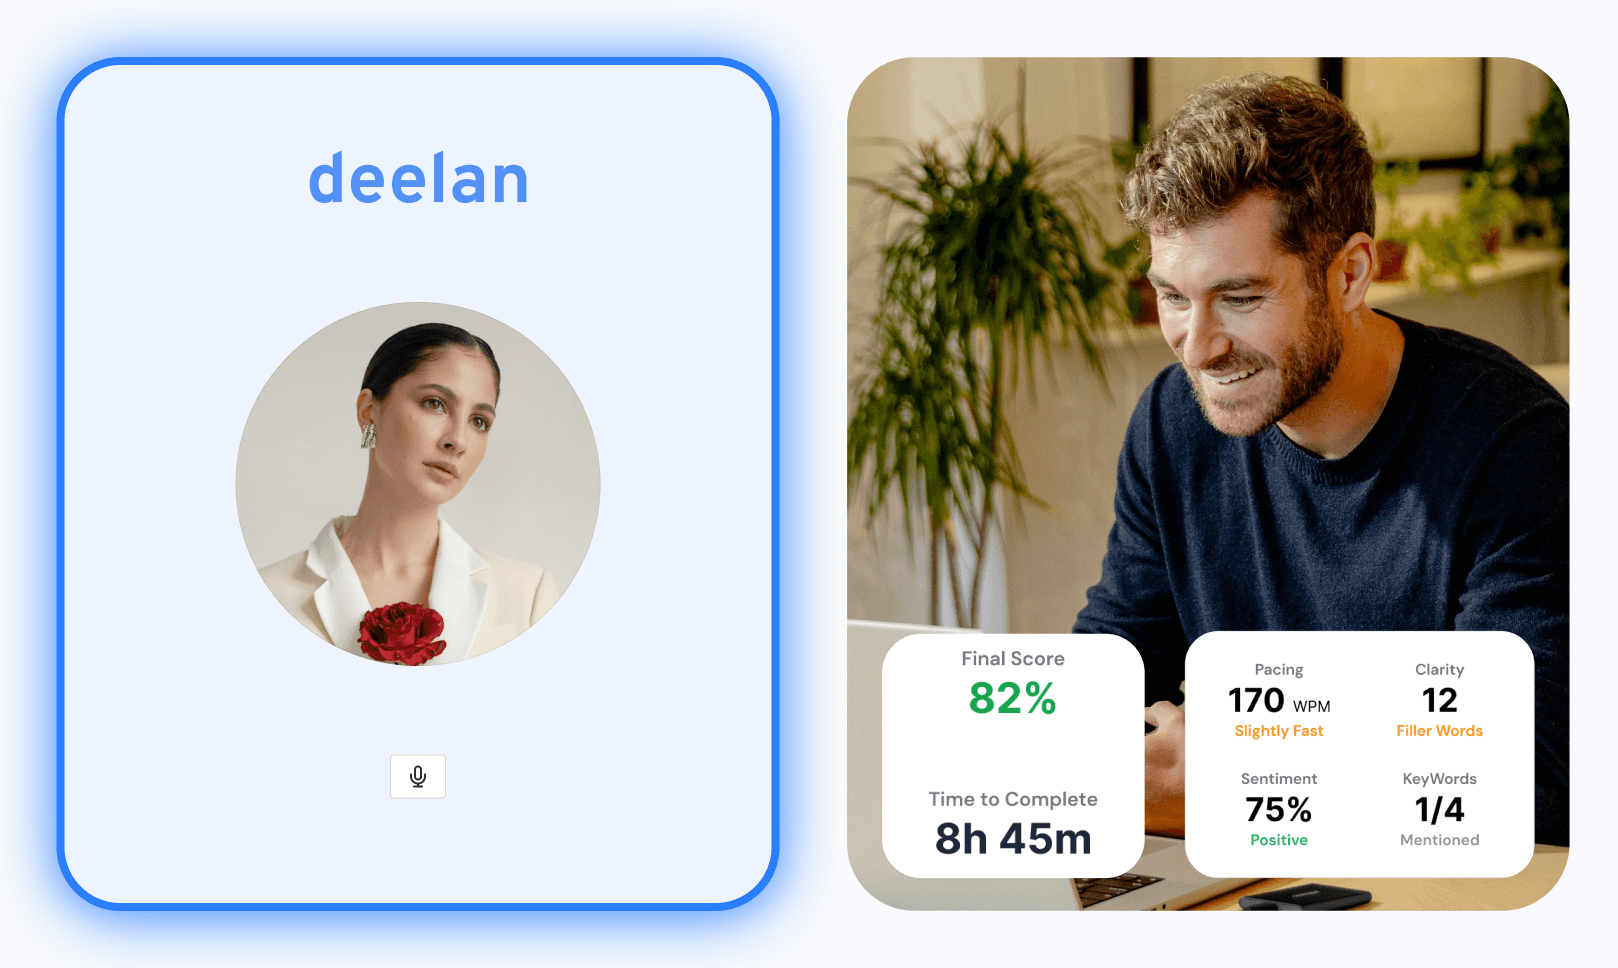
What makes roleplay analytics different from regular quiz scores?
Quiz scores measure recall. Roleplay analytics measure application under pressure. A rep who scores 90% on a knowledge check might still struggle with pacing, filler words, or handling a tough objection. Roleplay surfaces the gap between knowing and doing.
Transform Your Training into a Performance Engine
If you’re serious about performance, LMS reporting and analytics can’t stop at completions.
Deelan gives you actionable visibility into progress, readiness, gaps, and what to do next—so training drives outcomes.


